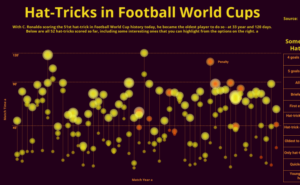
I began the process of looking for some sort of data visualization by searching for data visualization in relation to sports, something I am really interested in. A website that immediately popped up was Tableau, which is an American software company that provides interactive data visualization services. It is one of the most popular companies within its fields and businesses use it to help portray data to clients and customers. Looking through the link I was able to find something that caught my eye which was a data visualization of all the hat-tricks (3 goals in a game) which have been scored in the World Cup history.
The data visualization being portrayed is the player who scored the goals, how many he scored, what minutes of the game the goals were scored, and versus what specific team they were scored on. I think the data does a great job of conveying the information that it is trying to give to the user as we are able to hover our mouse over each dot that tells you what specific minute the goal was scored in the game. Other aspects I enjoyed about the visualization is that the dots are bigger for players who scored more than 3 goals such as 4 or 5 goals in the game showing how big of a deal it is. Another feature is that on the right side of the visualization there is a column highlighting “Some Special Hat-Tricks” such as the oldest and youngest players to score a hat trick and many other interesting facts. The data is extremely convincing as I am able to see in-depth each data point of every goal. This piece of work would still work without visualization, but it would just be a long and complex list that would be difficult to follow and would be hard to distinguish any highlights.
I think the style of the way the data is being portrayed suits the large data set. At first it was a little confusing to distinguish what was going on, but I was soon able to figure it out. The reason it is complicated is because there are so many data points making it a crowded data visualization. The currently style allows the user to hover each specific goal and see the moment in time where it was scored. I don’t think too many other styles would work with such a large data set as something like a bar or pie chart would not be able to portray the data properly. The person who made the visualization is named Harpreet Ghuman by using Tableau and gathering the data from Wikipedia. He is currently a manger at Ernst & Young as a technology consultant and has a specific passion for data visualization.
The audience for this publication is sports fans broadly and soccer fans who are interested in historical data more specifically. The context for where it is found is on the Tableau website under the “Sports + Data Viz Gallery” section. The source for the data is actually given in the original visualization and is a link to a Wikipedia page that details all the World Cup hat tricks. Harpreet must have had to gather all the data and then manipulate it inside Tableau. There are no biases by the author as it is historical data and facts that have happened and cannot be changed. The only possible bias could be the column on the right for what he chose as a “Special Hat-Trick”. Overall, I think the author did a great job with this data visualization and could not add much more without it being too crowded and over complicated.
Click this link to interact with the data visualization whose image is shown below.